So this is more like a show case rather than a indepth analysis. It was just something I found interesting and wantd to explore with JS canvas.
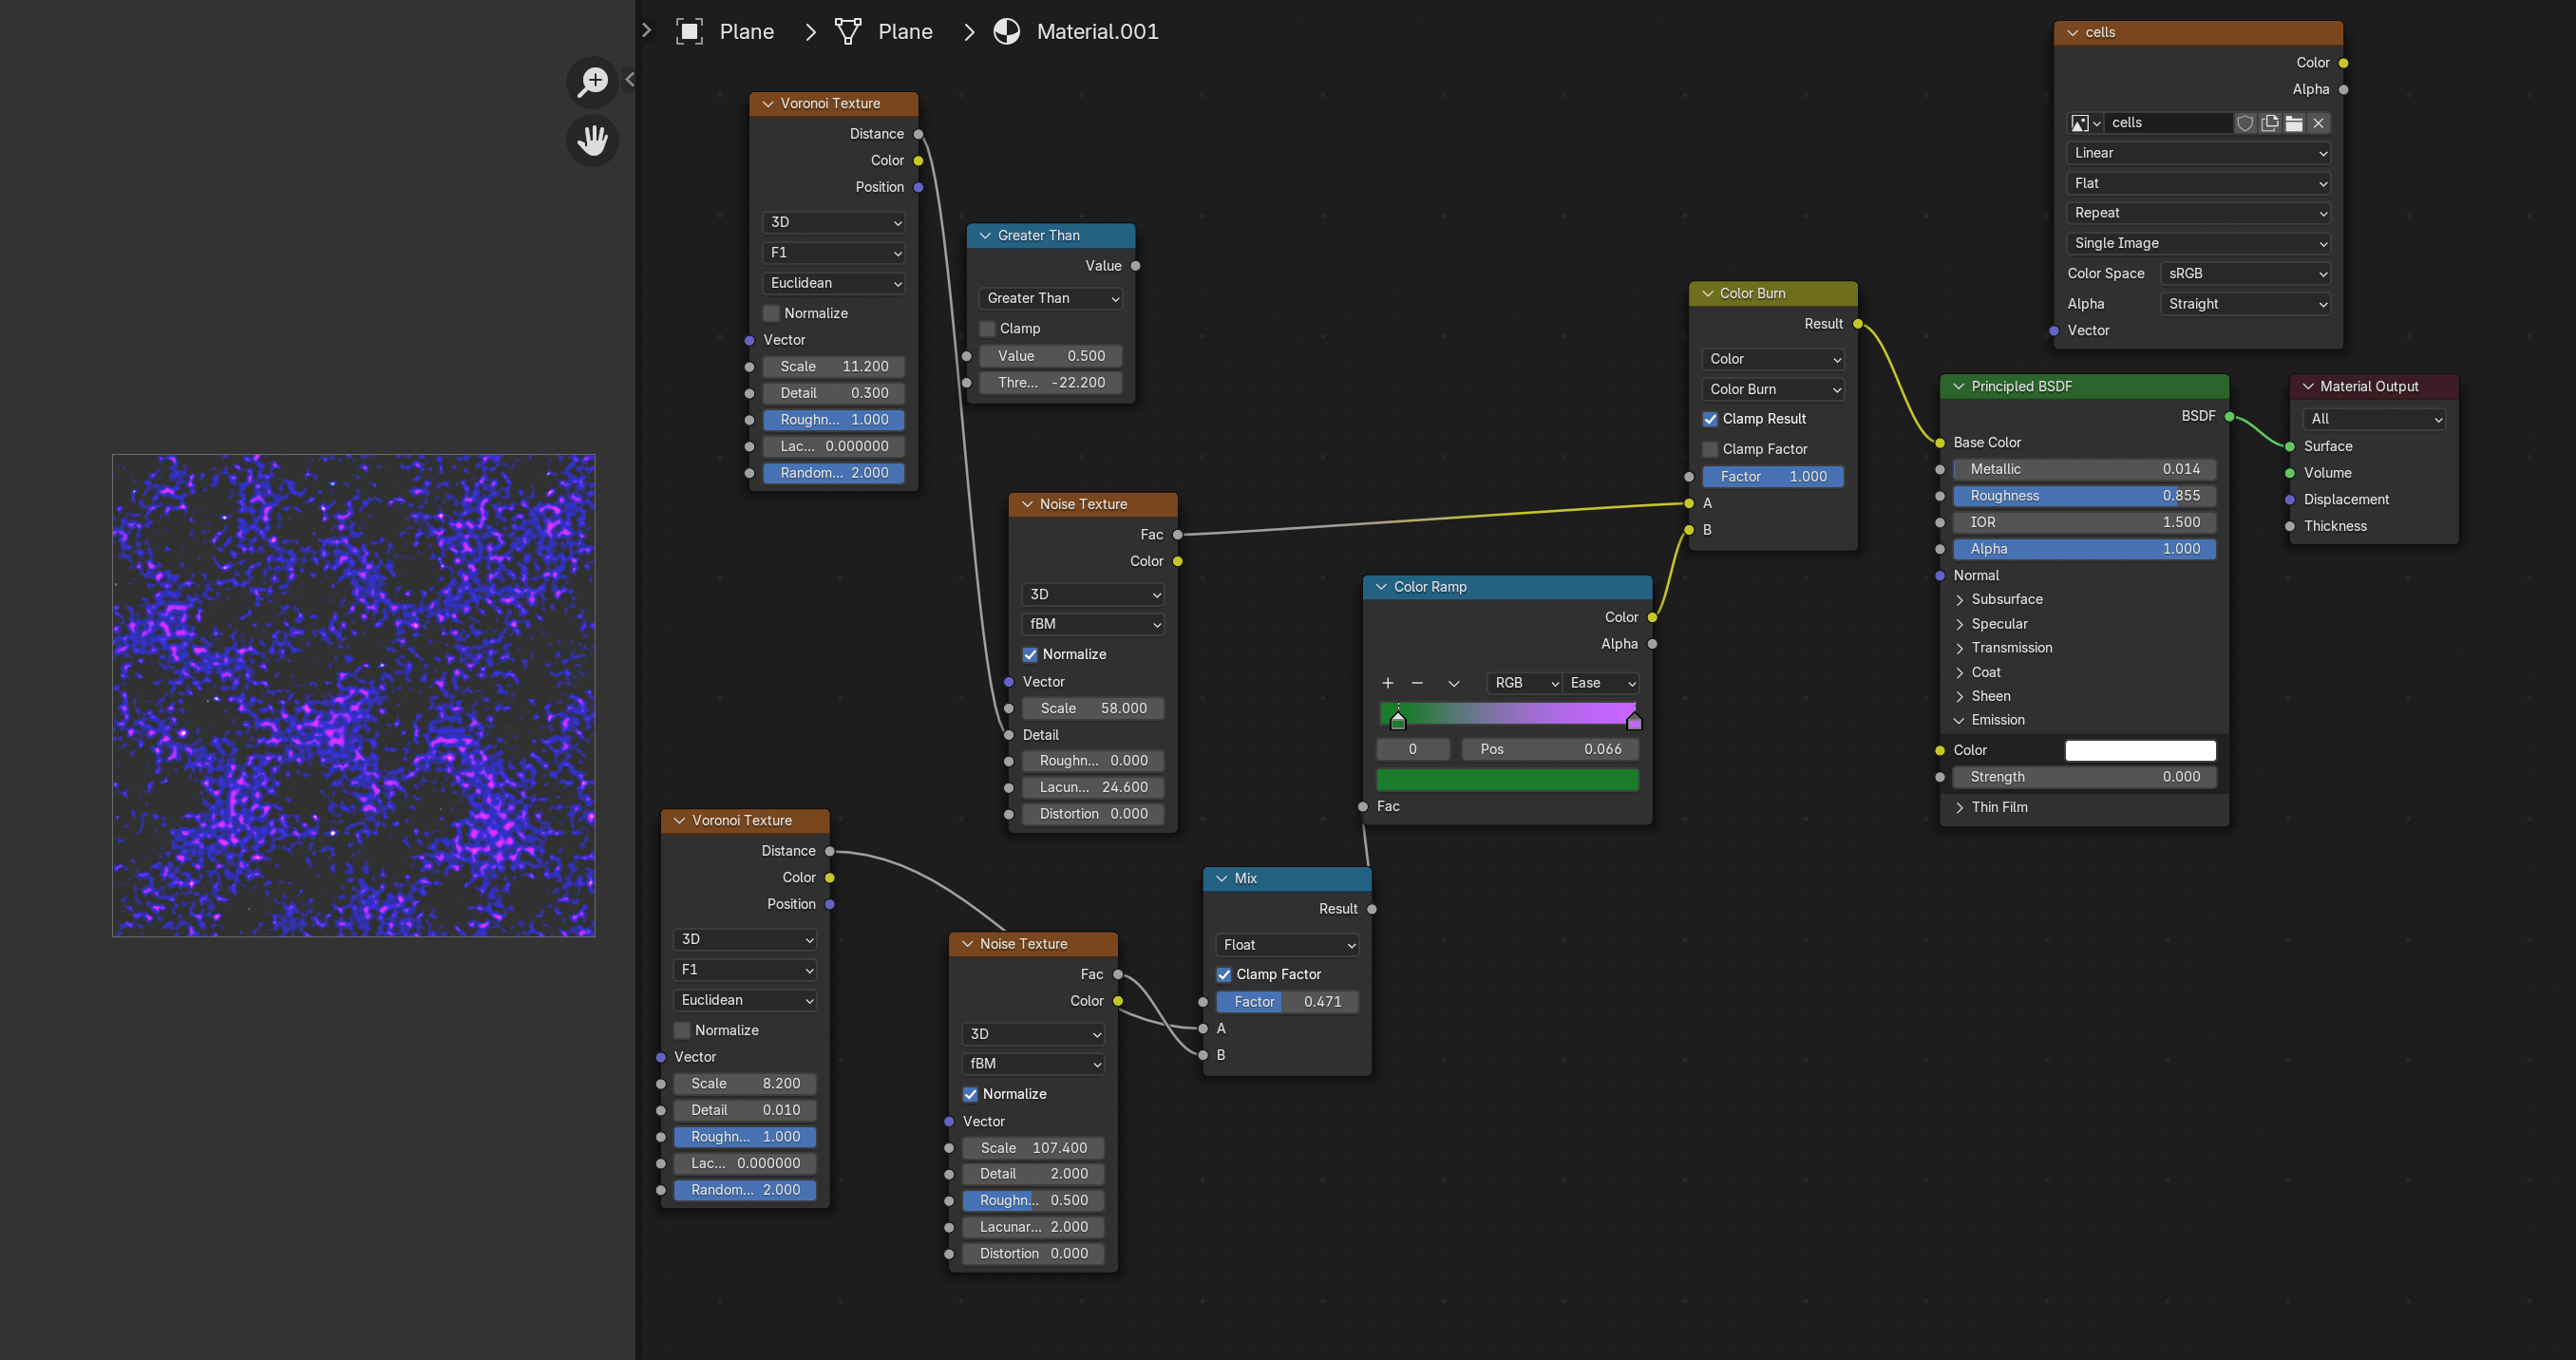
I created a node graph in blender which mimiced a star map, heat map or cell imaging result.
Here is the node graph.

It creates a nice image which resembles a star map or the result of a cell imaging processes.

So the aim of the experiment was to cluster sections of an image based on a color and threshold color value.
What does this mean?
It means can we define an edge on a complex image filled with noisy data?
And the result is yes you can to a degree.
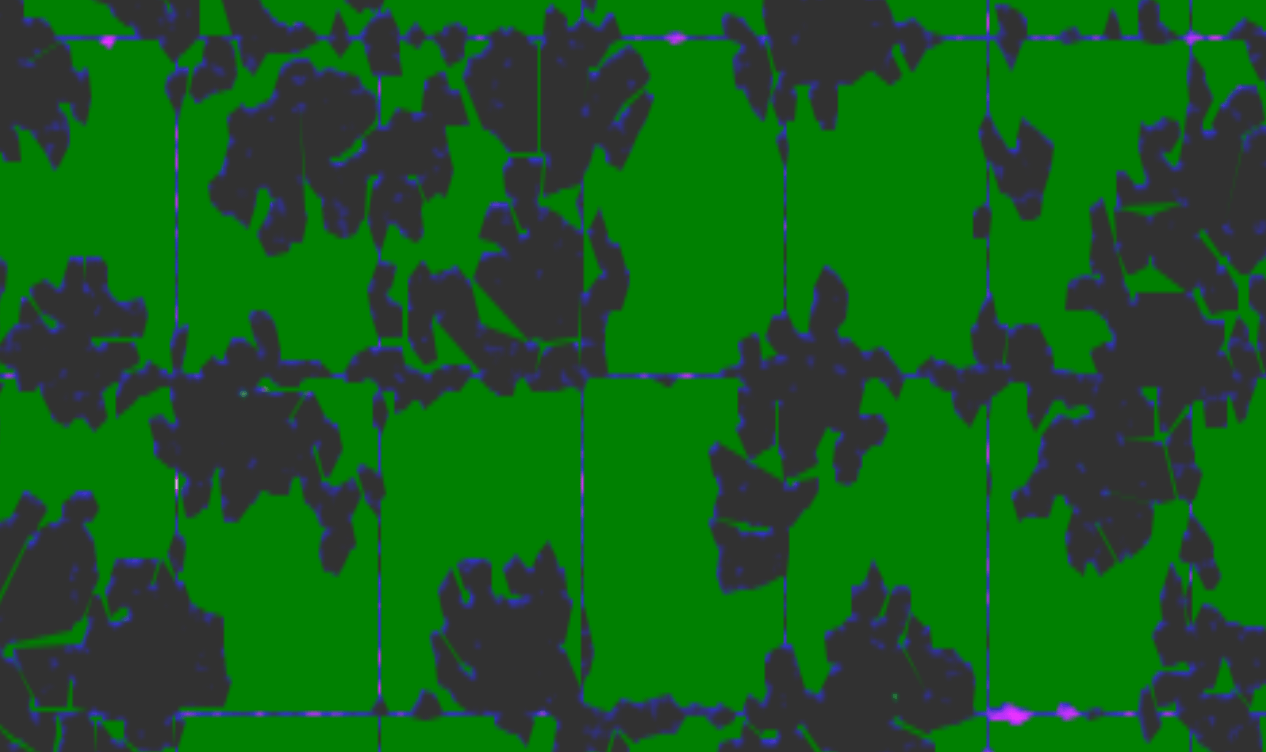
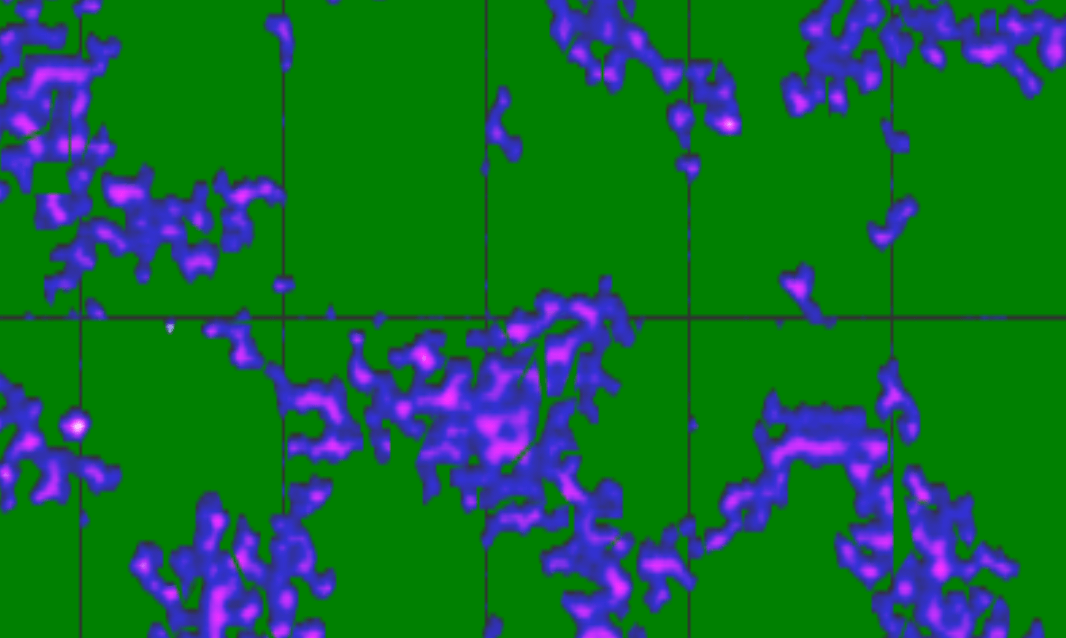
Below are the 3 images of the original map, the dark spots highlighted and then the light area highlighted.


As you can see by manipulating the color and the concave modulator we can highlight different areas of a very noisy image.
The principle is we split the image into sections and then use a concave hull around specific coloured pixels to create a border and then fill this hull with a color via JS canvas methods.
Below is the example code:
1import { useEffect } from 'react';2import hull from 'hull.js'34function loadImageToCanvas(imagePath, canvasId) {5 const canvas = document.getElementById(canvasId);6 const ctx = canvas.getContext('2d');78 const img = new Image();910 img.src = imagePath;1112 img.onload = function() {13 ctx.drawImage(img, 0, 0, canvas.width, canvas.height);14 splitImageIntoSquares(75, ctx, canvas);15 };16}1718function splitImageIntoSquares(size, ctx, canvas) {19 const imageData = ctx.getImageData(0, 0, canvas.width, canvas.height);20 const { width, height } = imageData;21 const squares = [];2223 for (let y = 0; y < height; y += size) {24 for (let x = 0; x < width; x += size) {25 const squareWidth = Math.min(size, width - x);26 const squareHeight = Math.min(size, height - y);2728 const squareImageData = ctx.createImageData(squareWidth, squareHeight);2930 for (let row = 0; row < squareHeight; row++) {31 for (let col = 0; col < squareWidth; col++) {32 const srcIndex = ((y + row) * width + (x + col)) * 4;33 const dstIndex = (row * squareWidth + col) * 4;3435 squareImageData.data[dstIndex] = imageData.data[srcIndex];36 squareImageData.data[dstIndex + 1] = imageData.data[srcIndex + 1];37 squareImageData.data[dstIndex + 2] = imageData.data[srcIndex + 2];38 squareImageData.data[dstIndex + 3] = imageData.data[srcIndex + 3];39 }40 }4142 squares.push({43 x,44 y,45 width: squareWidth,46 height: squareHeight,47 data: squareImageData48 });49 }50 }5152 processSquares(squares, ctx)5354 return squares;55}5657function processSquares(squares, ctx) {58 const thresholdColor = { r: 49, g: 49, b: 49 };59 // const thresholdColor = { r: 49, g: 49, b: 213 };60 const threshold = 80;61 squares.forEach(square => {62 const { x, y, width, height, data } = square;63 const points = [];6465 for (let row = 0; row < height; row++) {66 for (let col = 0; col < width; col++) {67 const index = (row * width + col) * 4;68 const r = data.data[index];69 const g = data.data[index + 1];70 const b = data.data[index + 2];7172 if (isColorInThreshold(r, g, b, thresholdColor, threshold)) {73 points.push({ x: x + col, y: y + row });74 }75 }76 }7778 if (points.length > 0) {79 // 4 for black80 // 7 for blue81 const h = hull(points.map((item) => ([item.x, item.y])), 4);8283 drawConcaveHull(h, ctx);84 }85 });86}8788function isColorInThreshold(r, g, b, targetColor, threshold) {89 return Math.abs(r - targetColor.r) < threshold &&90 Math.abs(g - targetColor.g) < threshold &&91 Math.abs(b - targetColor.b) < threshold;92}9394function drawConcaveHull(hull, ctx) {95 ctx.strokeStyle = 'red'; // Color of the hull border96 ctx.lineWidth = 0;97 ctx.beginPath();9899 hull.forEach((point, index) => {100 if (index === 0) {101 ctx.moveTo(point[0], point[1]);102 } else {103 ctx.lineTo(point[0], point[1]);104 }105 });106107 ctx.fillStyle = "green";108 ctx.fill()109 ctx.closePath();110 // ctx.stroke();111}112113114const constructCanvas = () => {115 loadImageToCanvas('/cells.png', 'canvas1');116}117118const ClusteredConcave = () => {119120 useEffect(() => {121 constructCanvas()122 }, [])123124 return (125 <canvas id="canvas1" width="500" height="300"/>126 )127}128129export default ClusteredConcave;
If you have any questions, reach out to me [email protected], Id be more than happy to discuss.