This is a precursor to getting 3D centroids and then doing normal reconstruction for point clouds and therefore leading to light calculations.
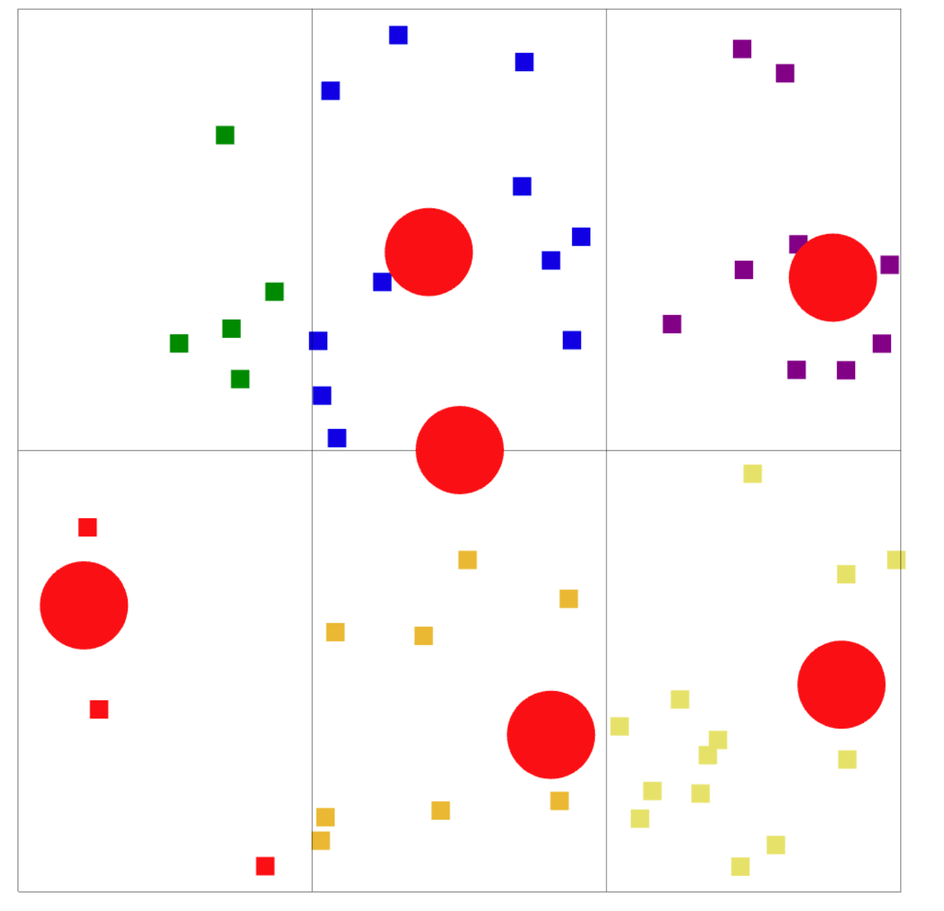
Below shows whats been accomplished in this little bit of research.

What is a centroid?
In Point Clouds: The centroid of a group of points is calculated as the average of their coordinates, providing a central point that summarizes the location of the group.
Imagine this:
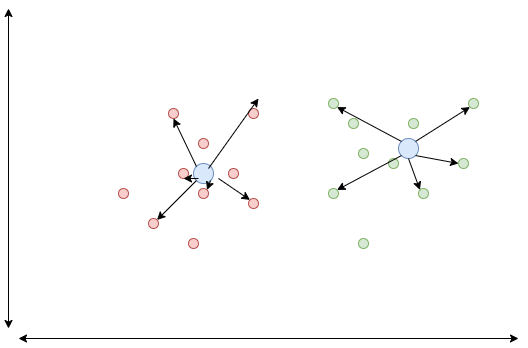
So once we have the centre points for local point clouds we can essentially constuct normals which can then subsequently be used in lighting calculations.
We can do some creative things to determine if the point is within the cloud or on the outer edges. To be discussed in later posts.
I have no idea if this will work but its a creative way to approach the normal issues for point clouds in 3JS.
Here is the code.
1import React, { useRef, useEffect } from 'react';2import { Canvas, useFrame } from '@react-three/fiber';3import * as THREE from 'three';45function calculateAverages(positions, numPoints, boxSize) {6 // Initialize section sums and counts7 const sectionSums = Array(6).fill(null).map(() => ({ x: 0, y: 0, count: 0 }));89 const thirdBoxSize = boxSize / 3;10 const halfBoxSize = boxSize / 2;1112 // Loop through the positions13 for (let i = 0; i < numPoints; i++) {14 const x = positions[i * 3];15 const y = positions[i * 3 + 1];1617 // Determine xSection (left, middle, right)18 let xSection;19 if (x < -thirdBoxSize) {20 xSection = 0; // Left21 } else if (x < thirdBoxSize) {22 xSection = 1; // Middle23 } else {24 xSection = 2; // Right25 }2627 // Determine ySection (bottom, top)28 const ySection = y < 0 ? 0 : 1;2930 // Calculate section index31 const sectionIndex = xSection + ySection * 3;3233 // Accumulate sums and counts34 sectionSums[sectionIndex].x += x;35 sectionSums[sectionIndex].y += y;36 sectionSums[sectionIndex].count += 1;37 }3839 // Calculate averages for each section40 const averages = sectionSums.map(({ x, y, count }) => {41 if (count === 0) return { x: 0, y: 0 }; // Avoid division by zero42 return { x: x / count, y: y / count };43 });4445 return averages;46 }4748 function calculateSectionIndices(positions, numPoints, boxSize) {49 const sectionIndices = new Array(numPoints);50 const horizontalDivisions = 2; // Number of horizontal sections51 const verticalDivisions = 3; // Number of vertical sections52 const horizontalStep = boxSize / horizontalDivisions;53 const verticalStep = boxSize / verticalDivisions;5455 for (let i = 0; i < numPoints; i++) {56 const x = positions[i * 3];57 const y = positions[i * 3 + 1];5859 // Determine horizontal section60 const horizontalSection = Math.floor((y + boxSize / 2) / horizontalStep);6162 // Determine vertical section63 const verticalSection = Math.floor((x + boxSize / 2) / verticalStep);6465 // Ensure sections are within valid range66 const clampedHorizontalSection = Math.min(horizontalDivisions - 1, Math.max(0, horizontalSection));67 const clampedVerticalSection = Math.min(verticalDivisions - 1, Math.max(0, verticalSection));6869 // Calculate section index70 sectionIndices[i] = clampedHorizontalSection * verticalDivisions + clampedVerticalSection;71 }7273 return sectionIndices;74 }757677function Points({ numPoints, boxSize }) {78 const pointsRef = useRef();79 const velocities = useRef(new Float32Array(numPoints * 2));80 const groupRef = useRef(null);8182 const colors = [83 new THREE.Color("red"),84 new THREE.Color("orange"),85 new THREE.Color("yellow"),86 new THREE.Color("green"),87 new THREE.Color("blue"),88 new THREE.Color("purple"),89 ];9091 useEffect(() => {92 const positions = pointsRef.current.geometry.attributes.position.array;93 const colorsArray = pointsRef.current.geometry.attributes.color.array;9495 for (let i = 0; i < numPoints; i++) {96 const x = Math.random() * boxSize - boxSize / 2;97 const y = Math.random() * boxSize - boxSize / 2;98 positions[i * 3] = x;99 positions[i * 3 + 1] = y;100 positions[i * 3 + 2] = 0;101102 velocities.current[i * 2] = (Math.random() - 0.5) * 0.01;103 velocities.current[i * 2 + 1] = (Math.random() - 0.5) * 0.001;104 }105106 const sectionIndices = calculateSectionIndices(positions, numPoints, boxSize);107108 for (let i = 0; i < numPoints; i++) {109 const color = colors[sectionIndices[i]];110 colorsArray[i * 3] = color.r;111 colorsArray[i * 3 + 1] = color.g;112 colorsArray[i * 3 + 2] = color.b;113 }114115 pointsRef.current.geometry.attributes.position.needsUpdate = true;116 pointsRef.current.geometry.attributes.color.needsUpdate = true;117 }, [numPoints, boxSize, colors]);118119 useFrame(() => {120 const positions = pointsRef.current.geometry.attributes.position.array;121122 for (let i = 0; i < numPoints; i++) {123 positions[i * 3] += velocities.current[i * 2];124 positions[i * 3 + 1] += velocities.current[i * 2 + 1];125126 if (positions[i * 3] <= -boxSize / 2 || positions[i * 3] >= boxSize / 2) {127 velocities.current[i * 2] *= -1;128 }129 if (positions[i * 3 + 1] <= -boxSize / 2 || positions[i * 3 + 1] >= boxSize / 2) {130 velocities.current[i * 2 + 1] *= -1;131 }132 }133134 const sectionIndices = calculateSectionIndices(positions, numPoints, boxSize);135 const colorsArray = pointsRef.current.geometry.attributes.color.array;136137 for (let i = 0; i < numPoints; i++) {138 const color = colors[sectionIndices[i]];139 colorsArray[i * 3] = color.r;140 colorsArray[i * 3 + 1] = color.g;141 colorsArray[i * 3 + 2] = color.b;142 }143144 pointsRef.current.geometry.attributes.position.needsUpdate = true;145 pointsRef.current.geometry.attributes.color.needsUpdate = true;146147 const averages = calculateAverages(positions, positions.length / 3, 1);148149 if (groupRef.current) {150 const children = groupRef.current?.children;151152 children.forEach((child, index) => {153 const position = child.position;154 const avg = averages[index];155 position.x = avg.x;156 position.y = avg.y;157158 })159 }160 });161162 return (163 <>164 <group ref={groupRef}>165 {[1,2,3,4,5,6].map((item, index) => {166 return (167 <mesh>168 <sphereGeometry args={[0.05, 24, 24]} />169 <meshBasicMaterial color={"red"} />170 </mesh>171 )172 })}173 </group>174 <points ref={pointsRef}>175 <bufferGeometry>176 <bufferAttribute177 attach="attributes-position"178 array={new Float32Array(numPoints * 3)}179 itemSize={3}180 count={numPoints}181 />182 <bufferAttribute183 attach="attributes-color"184 array={new Float32Array(numPoints * 3)}185 itemSize={3}186 count={numPoints}187 />188 </bufferGeometry>189 <pointsMaterial size={10} vertexColors />190 </points>191 </>192 );193}194195function SectionLines({ boxSize }) {196 const horizontalDivisions = 2; // Number of horizontal sections197 const verticalDivisions = 3; // Number of vertical sections198199 const horizontalStep = boxSize / horizontalDivisions;200 const verticalStep = boxSize / verticalDivisions;201202 const lineMaterial = new THREE.LineBasicMaterial({ color: 'black' });203204 // Define lines for section boundaries205 const lines = [206 // Vertical lines207 [208 [-boxSize / 2, -boxSize / 2, 0],209 [-boxSize / 2, boxSize / 2, 0],210 ],211 [212 [-boxSize / 2 + verticalStep, -boxSize / 2, 0],213 [-boxSize / 2 + verticalStep, boxSize / 2, 0],214 ],215 [216 [-boxSize / 2 + 2 * verticalStep, -boxSize / 2, 0],217 [-boxSize / 2 + 2 * verticalStep, boxSize / 2, 0],218 ],219 // Horizontal lines220 [221 [-boxSize / 2, -boxSize / 2, 0],222 [boxSize / 2, -boxSize / 2, 0],223 ],224 [225 [-boxSize / 2, -boxSize / 2 + horizontalStep, 0],226 [boxSize / 2, -boxSize / 2 + horizontalStep, 0],227 ],228 [229 [-boxSize / 2, -boxSize / 2 + 2 * horizontalStep, 0],230 [boxSize / 2, -boxSize / 2 + 2 * horizontalStep, 0],231 ],232 // Right-hand exterior vertical line233 [234 [boxSize / 2, -boxSize / 2, 0],235 [boxSize / 2, boxSize / 2, 0],236 ],237 // Bottom exterior horizontal line238 [239 [-boxSize / 2, boxSize / 2, 0],240 [boxSize / 2, boxSize / 2, 0],241 ],242 ];243244 return (245 <>246 {lines.map((line, index) => (247 <line key={index} geometry={new THREE.BufferGeometry().setFromPoints(line.map(p => new THREE.Vector3(...p)))}>248 <primitive object={lineMaterial} attach="material" />249 </line>250 ))}251 </>252 );253 }254255function App() {256 const boxSize = 1;257 const numPoints = 50;258259 return (260 <Canvas261 orthographic262 camera={{263 zoom: 480,264 position: [0, 0, 5],265 near: 0.1,266 far: 1000,267 }}268 style={{ height: "500px", width: "500px" }}269 >270 <color attach="background" args={["white"]} />271 <Points numPoints={numPoints} boxSize={boxSize} />272 <SectionLines boxSize={boxSize} />273 </Canvas>274 );275}276277export default App;
2 points which need to be addressed:
- Getting 3D centroids in real time
- Moving from CPU to GPU to take advantage of parallel processing power
Moving to the GPU will be tricky as state management is non existent apart from raw maths and deterministic calculations.